The Geometry of the Unknown: A Collective-Motion Approach to UAP
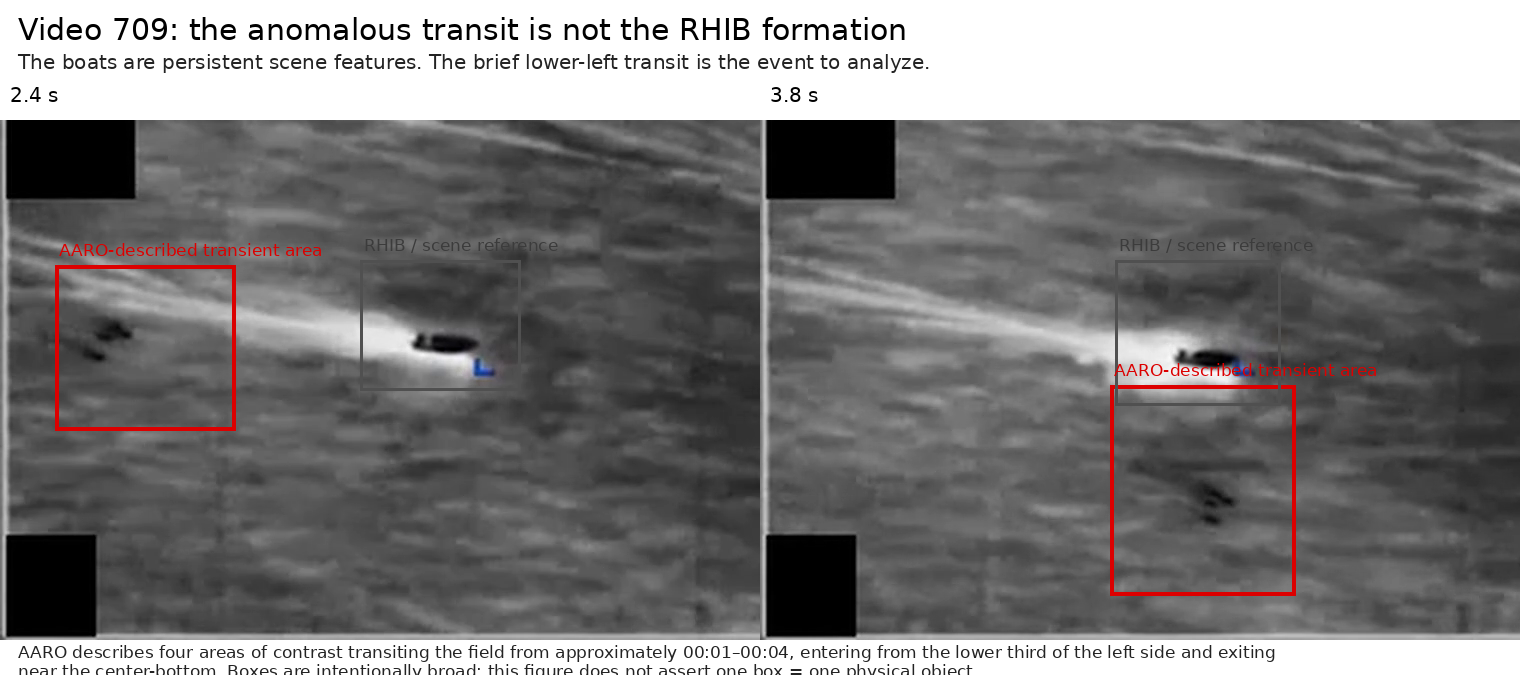
Correction — September 22, 2026: The initial analysis tracked the prominent boats in Video 709 rather than the brief transient described by AARO. Dataset v0.2 removes those boat-derived measurements. The quantitative charts now cover Videos 718 and 782 only; Video 709 remains an event-level case pending dedicated tracking.
Most analysis of unidentified anomalous phenomena begins with the individual object.
What shape is it? How fast is it moving? Does it have wings? Is there an exhaust plume? Is it a balloon, bird, aircraft, drone, atmospheric effect, sensor artifact, or something we have not correctly identified?
Those are necessary questions. They are not the only questions available to us.
Several publicly released Department of Defense videos contain something potentially more information-rich than a single unresolved point: multiple apparent features moving through the same scene at the same time.
Once there is more than one feature, the problem changes.
We can measure relationships.
Spacing. Alignment. Relative position. Subgroups. Changes in geometry. Neighbor relationships. Whether a disturbance appears to propagate through the group. Whether the group behaves as a rigid formation, an elastic flock, a collection of independent objects under common environmental forcing, or something created by sensor motion and image processing.
That suggests a different starting point:
Do not begin by asking what the objects are. Begin by asking what rules would be required to produce the observed collective motion.
This article is a first attempt to build that approach using three publicly released DoD/AARO videos and a small calibration dataset derived from them.
It is not an attempt to prove that the observed features are exotic technology, non-human intelligence, secret aircraft, birds, balloons, or anything else.
The purpose is narrower:
Can formation geometry itself become a measurable part of UAP research?
The three videos
The analysis began with three DoD videos released through the Defense Visual Information Distribution Service (DVIDS) and attributed to the All-domain Anomaly Resolution Office (AARO).
DOD_111719709 / DOW-UAP-PR050
Watch DOD_111719709 / DOW-UAP-PR050 on DVIDS
AARO assesses this video as likely derived from an infrared sensor aboard a U.S. military platform operating in the U.S. Central Command area of responsibility in 2022. The uploader-defined title describes “4 UAP Formation Iran 26 Aug 2022 over water.” AARO’s own video description is more conservative, referring to four areas of contrast transiting the sensor field of view.[1]
That distinction is important. Throughout this analysis we use terms such as apparent feature, resolved lobe, and area of contrast unless the evidence supports something stronger.
DOD_111719718 / DOW-UAP-PR052
Watch DOD_111719718 / DOW-UAP-PR052 on DVIDS
This is the longest and most difficult case. AARO states that it was likely derived from an infrared sensor aboard a U.S. military platform, but also states that the media was digitally altered before being uploaded to a classified network. Its description notes apparent cuts, multiple contrast filters, changing zoom levels, and increasingly degraded image quality.[2]
That makes the video interesting, but also dangerous to overinterpret.
Any quantitative work on this recording has to treat uninterrupted portions as separate analysis segments. Feature identity should not be carried across cuts or major processing transitions without independent evidence.
DOD_111985782 / DOW-UAP-PR135
Watch DOD_111985782 / DOW-UAP-PR135 on DVIDS
This 2025 U.S. Central Command report consists of infrared footage from a U.S. military platform. An accompanying mission report described “six small spherical objects grouped together,” characterized them as apparently agile and frequently changing direction, and contained a reporter-estimated speed of 480 mph. DVIDS explicitly cautions that its video description should not be read as an analytical judgment or factual determination regarding the event.[3]
The released imagery gives us a useful opportunity because several compact returns can be separately resolved during portions of the observation.
What we measured
The calibration dataset records measurements and event notes from the three released videos.
The corrected quantitative dataset currently contains:
- 73 apparent-feature centroid measurements
- 19 sampled formation states
- quantitative formation measurements from Videos 718 and 782
- pixel and normalized image coordinates
- number of separately resolved features
- group centroid
- formation width and height
- pairwise and nearest-neighbor separation statistics
- major-axis orientation
- a projected linearity index
- confidence notes and candidate discontinuities
Video 709 is treated differently in version 0.2. The initial pass mistakenly tracked the three visually dominant rigid-hull inflatable boats (RHIBs) rather than the brief AARO-described transient in the lower-left portion of the scene. Those boat-derived measurements have been removed from the UAP formation analysis. Video 709 remains in the dataset as an event-level case pending dedicated tracking of the approximately three-second transient.
Select any figure to open the full-resolution image.
The corrected dataset is available here:
The goal is reproducibility. Readers should be able to inspect the measurements, disagree with a centroid, substitute a better tracking method, or test a different hypothesis.
A note on “objects”
A compact bright or dark return in a processed infrared image is not automatically a one-to-one representation of a physical object.
Two physical sources can become unresolved and appear as one lobe. One physical source can potentially produce multiple image features depending on blur, sensor response, processing, contrast settings, saturation, and motion.
For that reason, the dataset records what the image resolves, not what we want the image to contain.
Formation is information
If three points simply happen to occupy the same image, we have an aggregation.
If they travel in roughly the same direction, we may have correlated motion.
If their relative positions persist, we may have something closer to a formation.
If their geometry changes in a coordinated way, the change itself becomes data.
This matters because organized geometry is rarely free.
Maintaining a particular relationship among moving agents generally requires some combination of sensing, feedback, environmental constraint, aerodynamic interaction, communication, or common external forcing.
Nature provides an enormous catalog of different solutions to that problem.
Humans have added several more.
The interesting question is therefore not:
Does this UAP formation look like geese, fighter aircraft, fish, or drones?
Similarity of shape is weak evidence.
The stronger question is:
Which measurable interaction rules are compatible with the motion we observe?
Nature has spent hundreds of millions of years experimenting with collective motion
The modern science of collective motion did not begin with UAP.
Researchers studying fish, birds, insects, mammals, and social insects have spent decades trying to understand how large groups produce coherent behavior from individual movement.
A useful history begins in the middle of the twentieth century. Reviews of collective-motion research trace early interaction-rule concepts to Charles Breder’s 1950s work on schooling fish, where attraction and repulsion were used to explain how individuals maintain spacing. By the early 1980s, computer models demonstrated that simple local rules could produce coordinated groups.[4]
In 1987, Craig Reynolds published the now-famous Boids model. Instead of scripting a flock as one object, Reynolds modeled independent agents responding to their local environment. Complex flock-like motion emerged from simple distributed behavior.[5]
In 1995, Tamás Vicsek and colleagues showed that self-propelled particles aligning with nearby neighbors could undergo a transition from disordered motion to coherent group movement.[6]
Then higher-resolution field measurement began changing the field again.
Researchers were no longer limited to asking which simulations looked like flocks. They could reconstruct individual trajectories and infer the interaction rules that real animals appeared to use.
That shift is directly relevant to UAP research.
We should not stop at saying that four or six points “look like a formation.”
We should try to infer the rules.
A field guide to collective motion
Different animal groups solve different problems. Those functions leave different signatures in their geometry.
| System | Why organize? | Characteristic behavior | Potential UAP research analogue |
|---|---|---|---|
| Migratory birds in V/echelon | Aerodynamic efficiency | Stable lateral and longitudinal offsets; wake exploitation | Does spacing depend on position relative to direction of travel? |
| Starling flocks | Cohesion, information transfer, predator response | Fluid group geometry; local interactions; rapid propagation of direction changes | Do individual features exchange relative positions while group coherence persists? |
| Fish schools | Cohesion, predator defense, foraging, information transfer | Attraction/repulsion relationships, speed changes, directional response to neighbors | Can acceleration or turning relationships be inferred between features? |
| Midge swarms | Mating aggregation and collective interaction | Strong correlations without global alignment | Can a group be dynamically coupled without maintaining a formation? |
| Locust bands/swarms | Collective migration | Density-dependent transition into aligned mass movement | Does the observed system change between disordered and ordered motion? |
| Emperor penguin huddles | Thermoregulation | Small movements propagate through a tightly packed group as waves | Do positional changes propagate sequentially through the group? |
| Ant trail systems | Navigation and resource exploitation | Individuals coordinate indirectly through environmental signals | Could apparent collective behavior arise through a shared environmental constraint rather than direct coordination? |
| Human formation flight | Lookout, deconfliction, maneuver, tactics, sometimes aerodynamic benefit | Assigned relative positions, leader/wingman relationships, deliberate station correction | Does geometry behave like role-based station keeping? |
That table is not a menu of explanations.
It is a menu of testable behaviors.
Birds: when geometry reduces the cost of flight
The familiar V formation used by some migrating birds is one of the clearest examples of geometry having a physical purpose.
Measurements of northern bald ibises found that birds flying in V formation positioned themselves in locations consistent with aerodynamic benefit from the wake of the bird ahead. Researchers also measured wingbeat phasing consistent with exploiting upwash and avoiding unfavorable downwash.[7]
That gives us a useful lesson.
If formation geometry is serving an aerodynamic function, position relative to the direction of travel matters.
Spacing should not be arbitrary.
That does not mean a line or V observed in UAP footage is aerodynamic. It means that if a formation persists, we should measure whether its geometry is coupled to its direction of movement.
Starlings: global order from local neighbors
A starling murmuration looks centralized.
It is not obvious that it needs to be.
Three-dimensional studies of starling flocks found evidence that interaction depends more on a bird’s nearest neighbors than on a fixed physical radius. Ballerini and colleagues reported a topological interaction structure, with later work commonly describing an interaction neighborhood of roughly six or seven nearest birds.[8][9]
The implication is profound.
A group can produce coordinated global motion without every member knowing the state of the entire group.
For UAP analysis, this suggests a measurable distinction:
Does each apparent feature maintain a particular geometric station, or does it maintain relationships with a changing set of nearby neighbors?
Those are different control architectures.
Fish: infer the rules from the trajectories
Some of the most useful work for this problem comes from fish-school research.
Researchers have reconstructed trajectories of schooling fish and used the data to infer interaction rules rather than assuming them. Work on golden shiners found that speed regulation, attraction, repulsion, and directional responses to nearby fish contributed to group behavior. Changes in motion could propagate through the group.[10]
This is very close to what we eventually want to do with higher-quality UAP data.
Not:
“That group looks coordinated.”
Instead:
“A heading change in feature A systematically precedes a change in B, and B systematically precedes C.”
Now we are talking about a measurable relationship.
Swarms: collective behavior does not always look orderly
Wild midge swarms provide an important warning against equating collective behavior with obvious geometric order.
Three-dimensional tracking of midge swarms found strong correlations among individuals despite a lack of global alignment. The researchers argued that correlation, rather than visible order alone, can be a hallmark of collective behavior.[11]
That gives us another useful negative lesson.
A UAP group does not have to form a wedge, line, V, or box to be interacting.
Conversely, a visually neat formation is not enough to prove interaction.
We need trajectories.
Penguins: look for propagation
Emperor penguin huddles solve a completely different physical problem: surviving extreme cold.
Researchers found that small movements can propagate through densely packed huddles as coordinated waves. Tiny local displacements eventually reorganize the larger group.[12]
The analogy here is not that UAP behave like penguins.
It is methodological.
When a group changes configuration, how does the change propagate?
Does every member change simultaneously?
Does one move first?
Does the response spread neighbor-to-neighbor?
That timing may tell us more than the final shape.
Ants: sometimes the environment is part of the control system
Ants offer another useful warning.
A colony can produce organized traffic without individual ants maintaining geometric formation. Trail pheromones create an external information structure that influences later movement. Local behavior and environmental feedback produce organized group-level paths.[13]
For UAP research, the analogue is the common-medium hypothesis.
Objects that appear to coordinate may instead be responding independently to the same flow, wind field, surface structure, electromagnetic environment, camera motion, or other shared constraint.
Before concluding that two observed features are communicating with one another, we need to ask whether the environment could be communicating with both.
Humans: formation can encode mission
Humans also use geometry deliberately.
U.S. Air Force training material describes tactical formations including line abreast and wedge. The geometry supports lookout, maneuverability, deconfliction, and tactical employment, with explicit lead and wingman responsibilities.[14]
Human aviation therefore gives us another important lesson:
formation geometry can be an external expression of function and role.
A position may exist because one member is following another.
Spacing may exist because sensors or weapons need coverage.
A formation may widen or compress because the tactical problem changed.
Again, shape is not enough.
But repeated geometry plus role-consistent motion can become evidence about the underlying control system.
What the three videos show
Our calibration dataset is small. The goal is not statistical certainty.
The goal is to demonstrate that collective-motion variables can be extracted at all.
Video 709: a brief transient against a much more obvious surface scene
Video 709 is a useful example of why target definition has to come before measurement.
The most visually prominent objects in the recording are three rigid-hull inflatable boats moving across the water with strong wakes. Those boats occupy much of the frame, are easy to segment, and travel on a broadly common axis.
They are not the event we are trying to characterize.
AARO’s public description identifies the relevant portion of the video much more specifically: from approximately 00:01 to 00:04, four areas of contrast transit the sensor field of view, entering from the lower third of the left side of the screen and exiting near the center of the bottom of the frame.[1]
That brief transit is the UAP-relevant observation.
Figure 1. DOD_111719709. The persistent RHIB is labeled only as a scene reference. The broad red boxes indicate the lower-left transient region described by AARO. They are not intended to assert exact object boundaries or a one-to-one physical-object count.
This also exposes an important methodological failure in our first pass. An automated or semi-automated tracker will naturally lock onto the highest-contrast, longest-lived features in the scene. In this case, that meant the boats.
The result looked mathematically tidy. It was also measuring the wrong thing.
The earlier near-perfect “linearity” result for Video 709 therefore is not a UAP result and has been removed from the corrected dataset.
The boats are still useful, but only as references. Their wakes and persistent motion may help us estimate image stabilization, sensor motion, and relative motion of the short-lived transient. They should not be mixed into the anomalous-feature formation statistics.
Because the UAP-relevant interval lasts only a few seconds and the apparent features are small, Video 709 should carry little inferential weight in this first article. Its value is more modest:
Can we recover the four AARO-described transient features, stabilize the scene using the persistent surface traffic, and determine whether their relative geometry contains any information during the short crossing?
That is a worthwhile follow-up analysis. It is not yet a finding.
For the quantitative comparisons that follow, we restrict the current formation metrics to Videos 718 and 782.
To describe projected geometry, we use a simple linearity index:
L = 1 − λ2 / λ1
where λ1 and λ2 are the major and minor eigenvalues of the two-dimensional position covariance matrix. A value near 1 means that the sampled feature centroids fall strongly along one image-plane axis. It does not establish a physical line in three-dimensional space.
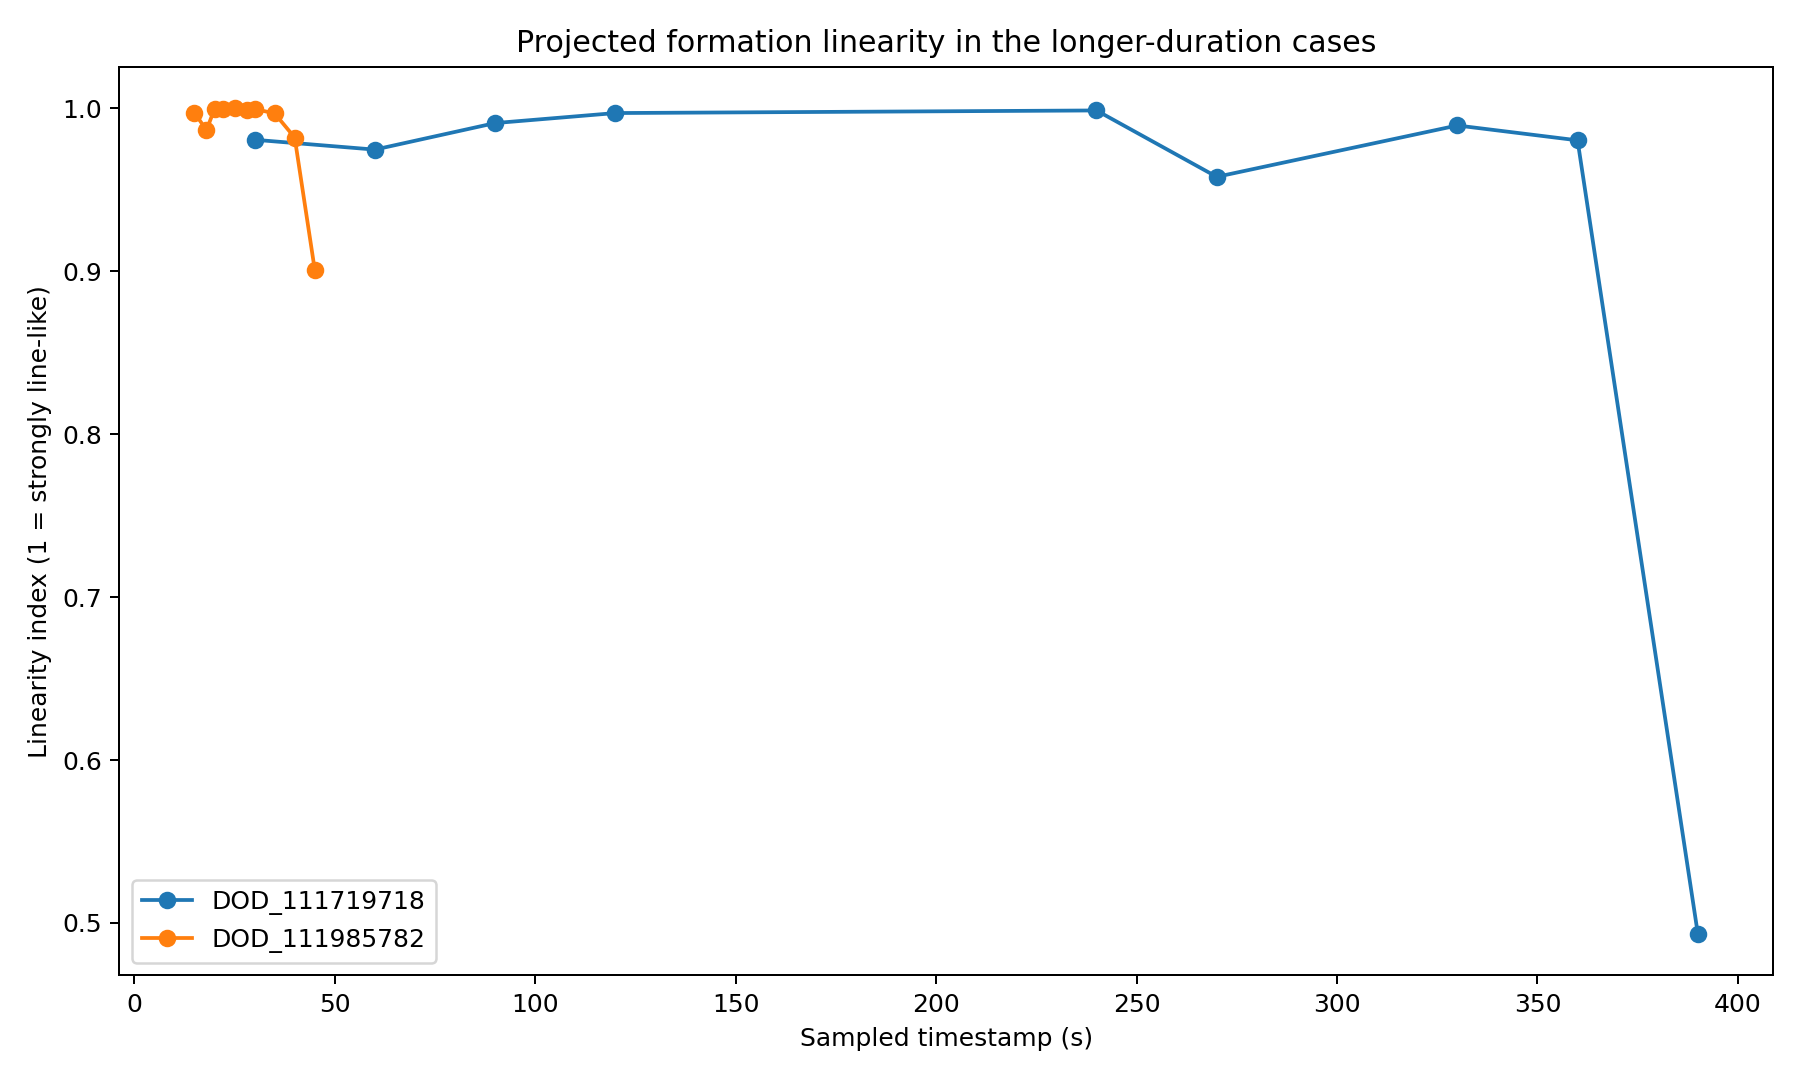
Figure 2. Projected linearity across sampled timestamps in the two longer-duration cases. Lines connect discrete samples for readability; they do not establish continuous tracks across edits. This is a geometric descriptor only; perspective, sensor motion, and processing remain competing explanations.
Video 718: a recurring subgroup-plus-offset-member pattern
Video 718 looks qualitatively different.
Several sampled portions show a close cluster accompanied by a substantially displaced feature. At 30 and 60 seconds, the geometry is visually consistent with what we have provisionally labeled a 3+1 topology.
“Topology” here does not mean we know that four physical objects are maintaining assigned positions.
It means that the image repeatedly contains three nearby resolvable features and another spatially offset feature.
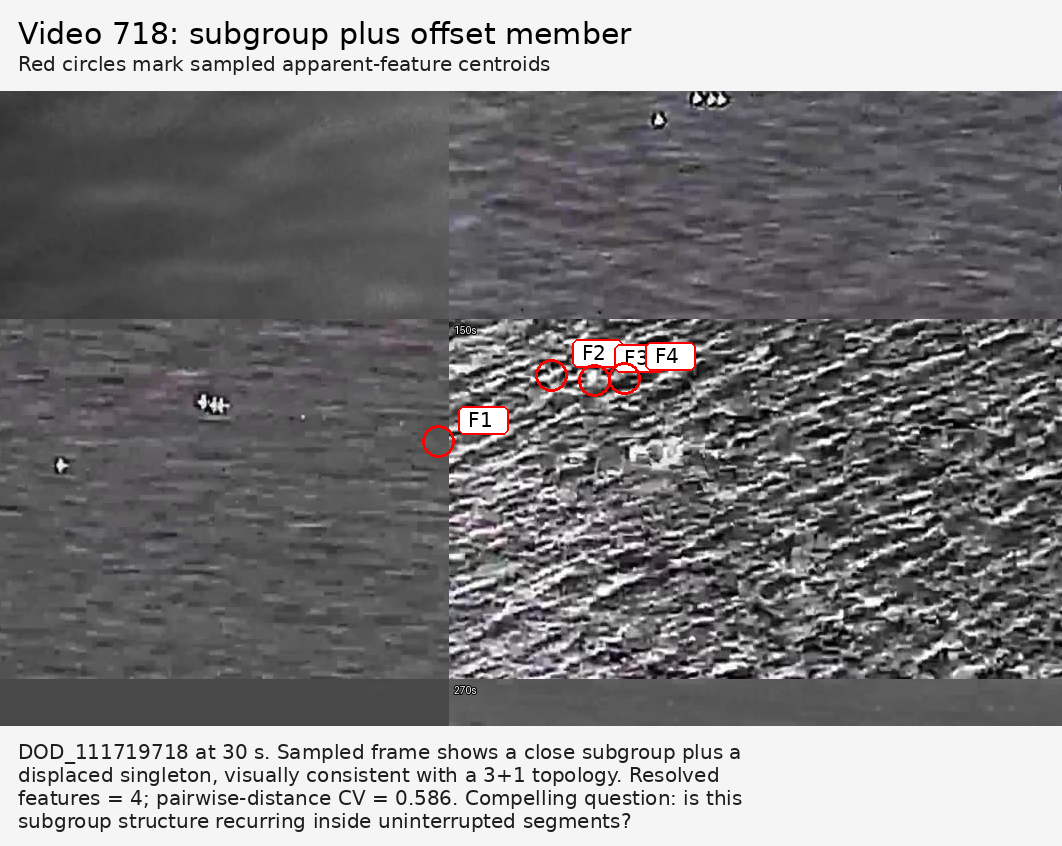
Figure 3. DOD_111719718 at approximately 30 seconds. A close subgroup appears with a displaced apparent feature. The pairwise-distance coefficient of variation in this sampled state is approximately 0.586.
A later sample provides another example.
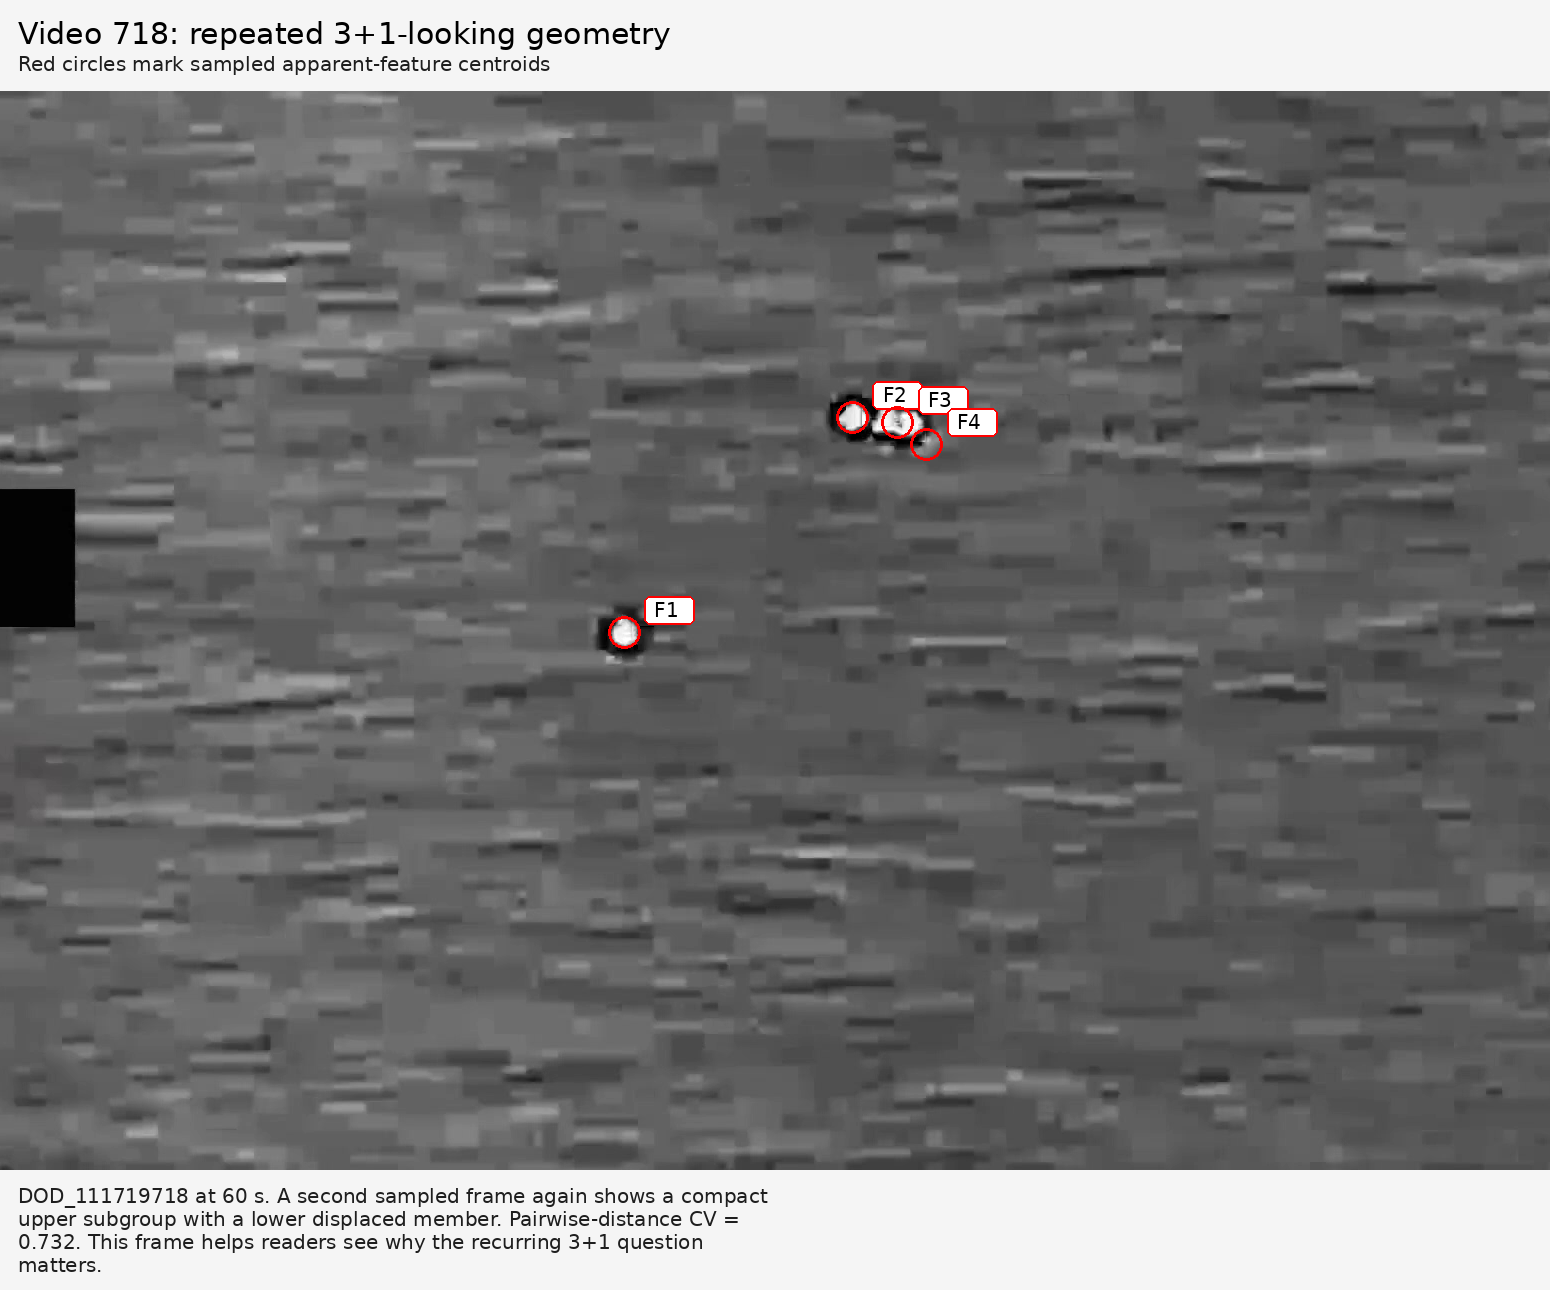
Figure 4. DOD_111719718 at approximately 60 seconds. A similar subgroup-plus-offset-member geometry is visible.
Across the samples used in this corrected quantitative dataset, Video 718 has a median pairwise-distance coefficient of variation of roughly 0.565, higher than Video 782.
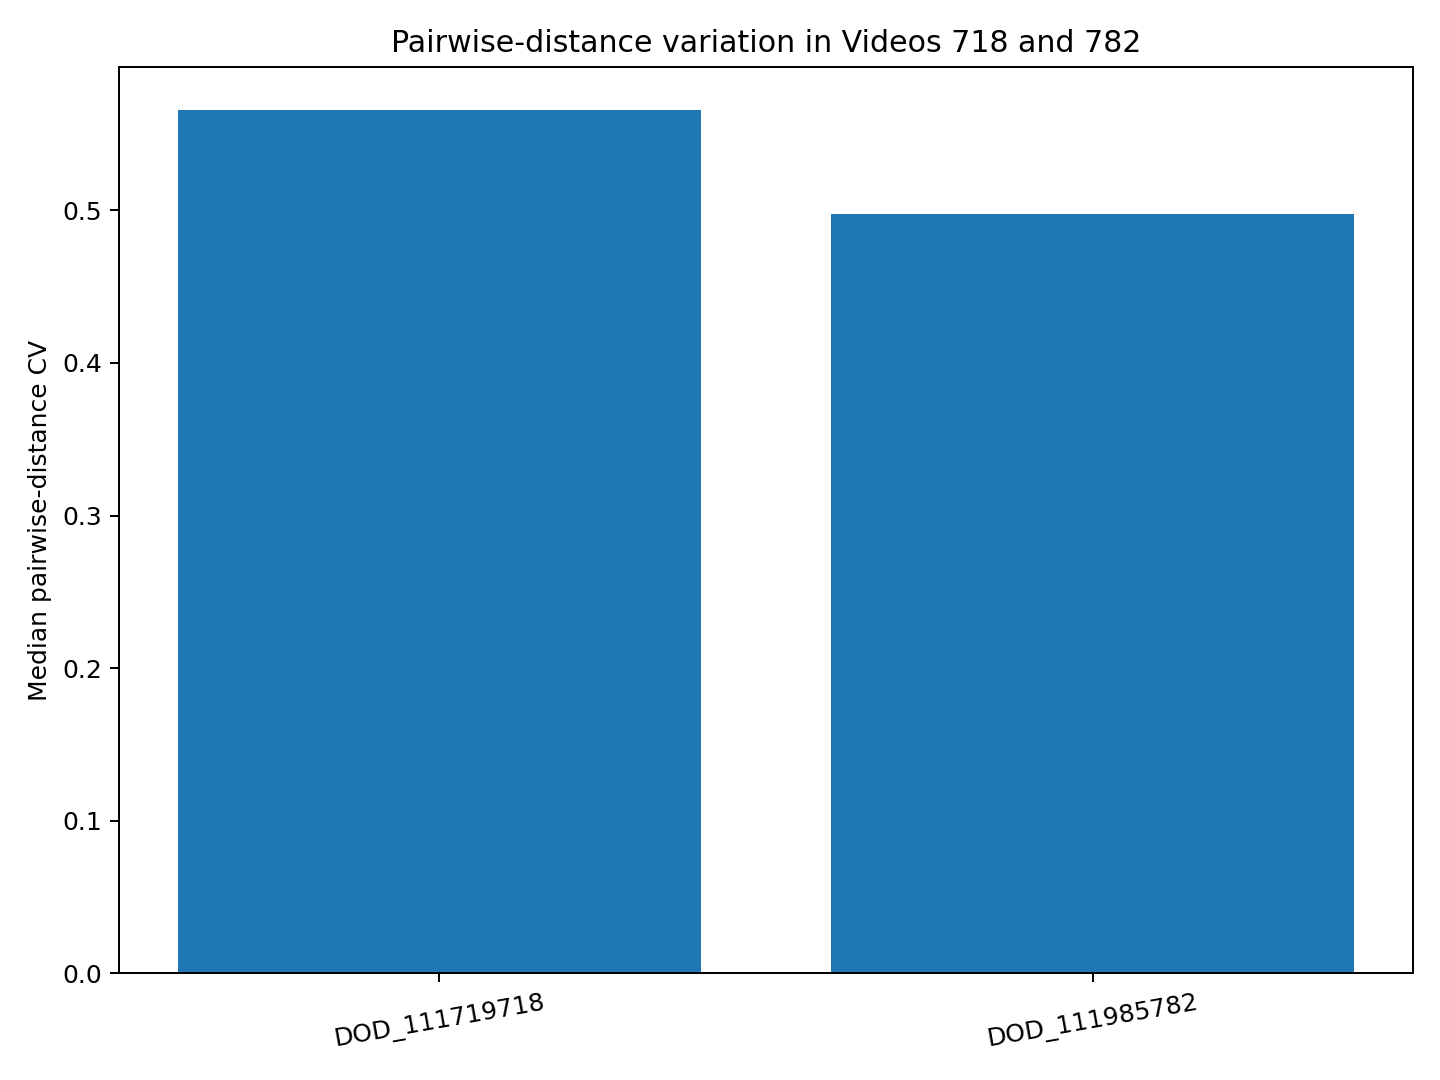
Figure 5. Median coefficient of variation of pairwise image-plane separation in sampled states from Videos 718 and 782. Video 718 is geometrically more heterogeneous in this initial comparison.
This is interesting, but it is also the video where caution matters most.
AARO says the media was digitally altered before upload and describes multiple apparent cuts, contrast changes, and zoom changes.[2]
So the test is not:
“Does 3+1 appear several times somewhere in the eight-minute video?”
The stronger test is:
Within continuous, internally consistent segments, does the same subgroup relationship persist through movement?
If yes, then we ask whether the displaced member leads, follows, remains at a stable normalized offset, or moves independently.
If no, the visual pattern may be projection, processing, or coincidence.
Video 782: feature count changes while a common axis often remains
Video 782 may eventually be the most useful of the three for collective-motion analysis.
The number of separately resolvable bright lobes changes through the recording.
That fact alone is not evidence that physical objects appear or disappear.
It is a measurement problem.
Nearby returns can merge below the effective resolution of the image and separate again later.
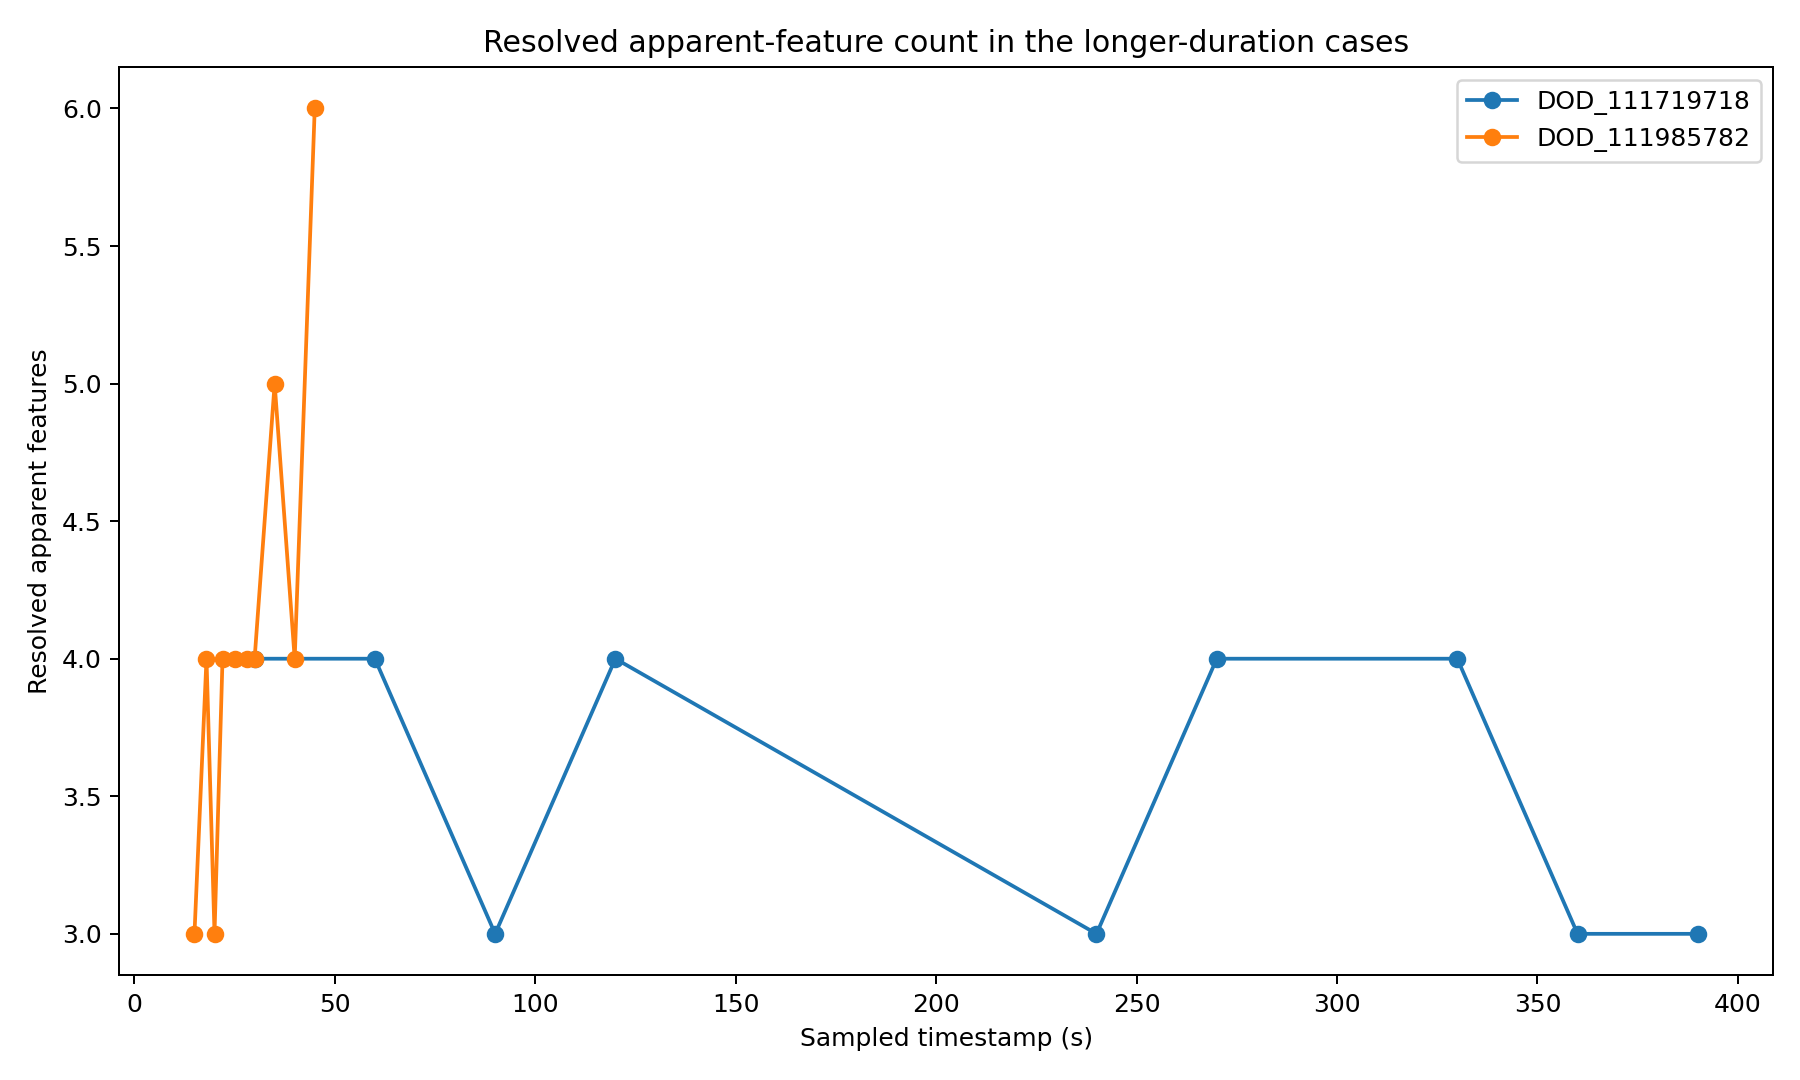
Figure 6. Number of separately resolved apparent features in sampled states from Videos 718 and 782. Lines connect discrete samples rather than continuous tracks. This is deliberately not labeled “object count.”
At approximately 20 seconds, three compact features are readily separable and strongly line-like in projection.
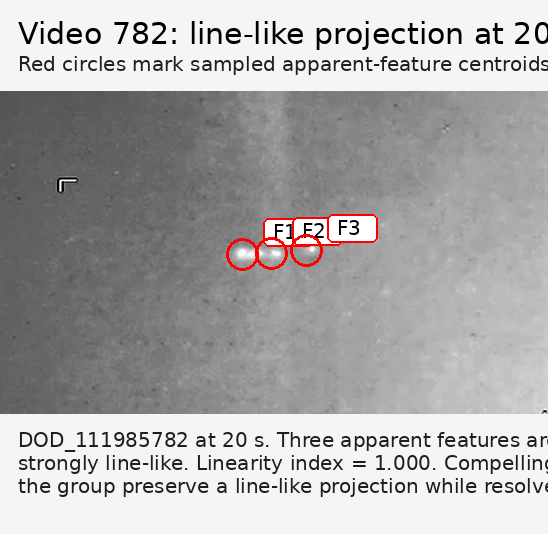
Figure 7. DOD_111985782 at approximately 20 seconds. Three apparent features are separately resolved along a common projected axis.
Later, additional lobes can be resolved while the group still presents a broadly elongated structure.
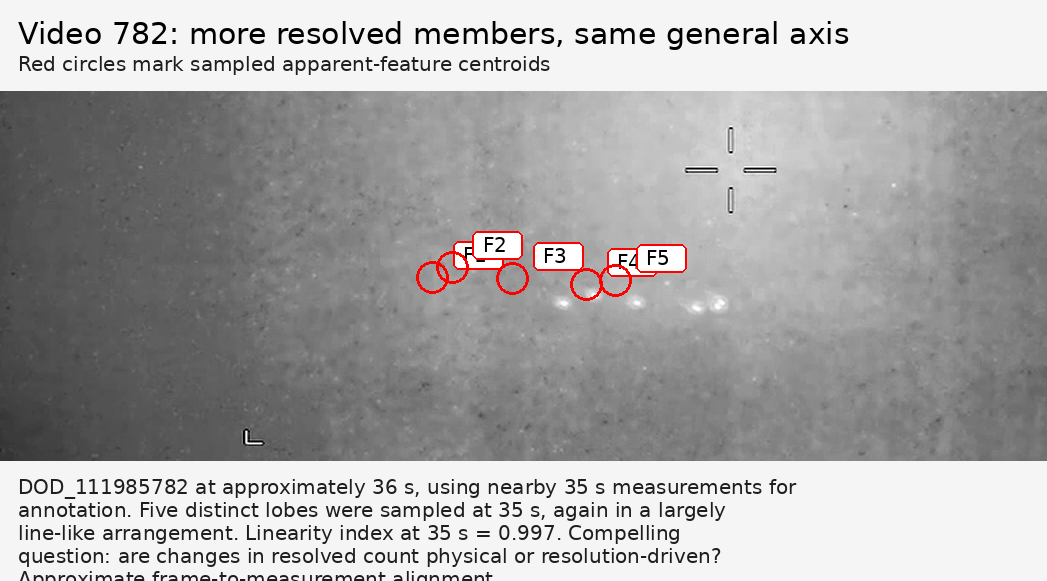
Figure 8. DOD_111985782 near 36 seconds. The annotation uses the nearby 35-second sampled centroid set, so the overlay should be treated as approximate. The scientifically interesting problem is whether changing resolved feature count represents physical separation or sensor-resolution merge/split behavior.
That gives us a concrete experiment.
Instead of counting objects manually, model the image as a changing set of point-spread functions.
Then ask whether a fixed number of latent sources moving continuously can explain the observed merges and splits.
If it can, the changing visible count tells us more about the imaging system than the underlying group.
If it cannot, then real changes in group geometry become a stronger possibility.
What the current data do not tell us
The fact that these videos were obtained from military systems does not turn the released copies into calibrated laboratory data.
For the public files used here, we do not have enough information to confidently reconstruct true three-dimensional positions.
Among the missing or uncertain variables are:
- slant range to each feature
- complete sensor field-of-view calibration
- precise camera line-of-sight orientation through time
- platform position, velocity, and attitude synchronized to every frame
- full image-processing history
- raw sensor values before compression and redaction
- point-spread function and saturation behavior
- atmospheric path information
- a validated one-to-one relationship between image lobes and physical objects
Without those variables, pixels are not meters.
A separation of 50 pixels is an angular/image-plane observation. It cannot be converted into physical spacing without geometry and range.
Likewise, motion through an image is not automatically true object velocity. Platform motion, camera slew, parallax, zoom, and stabilization all contribute.
This is not a reason to discard the footage.
It is a reason to ask questions that the footage is actually capable of answering.
The questions we should ask next
A collective-motion research program for UAP could be organized around a small number of falsifiable questions.
1. Does the formation survive stabilization?
Remove camera translation, rotation, zoom, and background motion.
If the group geometry disappears, the “formation” may be an imaging relationship rather than an object relationship.
2. Is spacing metric or topological?
Does each feature maintain a particular distance?
Or does it maintain relationships with a particular number of neighbors while physical/angular spacing changes?
That distinction is central in animal collective-motion research.
3. Who moves first?
Cross-correlate changes in heading and apparent velocity.
If A repeatedly changes before B, and B before C, a leader/follower or propagation model becomes testable.
4. Does the group behave like a rigid body?
If normalized pairwise distances remain almost invariant through a maneuver, we have a very different system from a flock whose members continuously rearrange themselves.
5. Do neighbors exchange?
Human role-based formations tend to preserve assigned relationships.
Many biological collectives allow much greater neighbor turnover.
Track the graph, not just the dots.
6. Does the group “breathe”?
Measure expansion and contraction.
Do members compress during turns and expand afterward?
Does formation scale vary with apparent speed?
7. Are there stable subgroups?
A recurring 3+1 or 2+2 structure may reveal more than total object count.
But only if it persists within continuous data.
8. Does a disturbance propagate?
A turn is an experiment.
So is acceleration.
So is compression.
Measure response delay from feature to feature.
9. Does geometry track the environment?
Compare the group with cloud motion, water texture, terrain, wind estimates, sensor movement, and other reference structure.
Common forcing has to remain a live hypothesis.
10. Can a simpler model reproduce it?
Fit competing models:
- independent trajectories
- common environmental forcing
- leader/follower control
- rigid formation keeping
- attraction/repulsion/alignment
- topological nearest-neighbor interaction
The question is not which model is most exciting.
The question is which model best survives contact with the data.
From screenshots to a behavioral taxonomy
UAP research has historically devoted enormous attention to morphology.
Sphere.
Disk.
Tic-tac.
Triangle.
Light.
Orb.
Those labels may be useful, but they describe what something looks like in a particular observation.
Collective motion gives us another axis of classification.
A future dataset might classify multi-feature observations by behavioral structure:
rigid formation, leader/follower, elastic flock, topological swarm, common-flow aggregation, subgrouped formation, uncorrelated co-observation, or insufficient data.
Those categories would not identify the phenomenon.
They would characterize the behavior.
That is often how science progresses when identity is uncertain: describe the repeatable properties first.
The most important lesson from animal behavior
The natural world gives us one final warning.
Complex group behavior does not necessarily imply complex centralized intelligence.
A murmuration can look choreographed.
A fish school can reverse direction almost as a unit.
An ant colony can construct a functioning traffic network.
A penguin huddle can transmit a displacement wave through thousands of bodies.
These systems can produce striking organization through local rules and feedback.
Reynolds demonstrated the computational version of that lesson in 1987: independently acting agents with simple local behaviors can generate movement that looks astonishingly coordinated.[5]
So if we observe organized UAP motion, we should resist two opposite mistakes.
The first is assuming organization automatically proves centralized intelligent control.
The second is assuming that because simple mechanisms can produce organization, every organized observation is therefore trivial.
Both skip the scientific work.
The job is to infer the rules.
Where this project goes from here
This dataset is deliberately small.
It should be treated as an early calibration of a method, not as evidence for a grand conclusion.
The immediate next step is continuous tracking.
For each uninterrupted segment, we want a trajectory for every resolvable apparent feature:
(xi(t), yi(t))
From those trajectories we can derive relative position, velocity, acceleration, formation orientation, neighbor identity, pairwise-distance stability, turn-response latency, and subgroup persistence.
Then we can begin comparing the observations against explicit generative models.
Could a flocking model reproduce the geometry?
Could simple independent trajectories plus camera motion reproduce it?
Could a rigid formation model?
Could a common wind or flow field?
Could the sensor’s point-spread function explain apparent merging and splitting?
Those are experiments we can run.
And that is the point.
UAP research does not become more scientific by choosing a preferred explanation and collecting unusual imagery around it.
It becomes more scientific when we turn unusual imagery into measurements, measurements into hypotheses, and hypotheses into tests that can fail.
These three videos leave us with far more questions than answers.
Good.
Questions are useful when we know how to measure them.
Data and reproducibility
The calibration dataset used in this article is published alongside the post:
- UAP Collective Motion Calibration Dataset v0.2 — Excel
- UAP Collective Motion Calibration Dataset v0.2 — CSV package
The current dataset contains manually curated and algorithm-assisted image-feature measurements from the publicly released video copies. Version 0.2 also documents the correction that removes the RHIB-derived Video 709 measurements from UAP formation statistics. Future versions should add continuous tracking, stabilization transforms, centroid uncertainty, explicit segment boundaries, model-fit results, and reproducible analysis code.
If you find an error in the measurements or can improve the tracking methodology, that is part of the experiment.
Sources
-
All-domain Anomaly Resolution Office / DVIDS. DOW-UAP-PR050, “4 UAP Formation Iran 26 Aug 2022 over water [CALLSIGN].”
Read source 1 -
All-domain Anomaly Resolution Office / DVIDS. DOW-UAP-PR052, “UAP USO Formation [CALLSIGN] (Mission).”
Read source 2 -
All-domain Anomaly Resolution Office / DVIDS. DOW-UAP-PR135, Unresolved UAP Report, Middle East, 2025.
Read source 3 -
Herbert-Read, J. E. Understanding how animal groups achieve coordinated movement. Journal of Experimental Biology (2016).
Read source 4 -
Reynolds, C. W. Flocks, Herds and Schools: A Distributed Behavioral Model. SIGGRAPH ’87 (1987).
Read source 5 -
Vicsek, T., Czirók, A., Ben-Jacob, E., Cohen, I., & Shochet, O. Novel Type of Phase Transition in a System of Self-Driven Particles. Physical Review Letters 75, 1226 (1995).
Read source 6 -
Portugal, S. J. et al. Upwash exploitation and downwash avoidance by flap phasing in ibis formation flight. Nature 505, 399–402 (2014).
Read source 7 -
Ballerini, M. et al. Interaction ruling animal collective behavior depends on topological rather than metric distance: Evidence from a field study. PNAS 105(4), 1232–1237 (2008).
Read source 8 -
Hildenbrandt, H., Carere, C., & Hemelrijk, C. K. Diffusion and Topological Neighbours in Flocks of Starlings: Relating a Model to Empirical Data. PLOS ONE (2015).
Read source 9 -
Katz, Y., Tunstrøm, K., Ioannou, C. C., Huepe, C., & Couzin, I. D. Inferring the structure and dynamics of interactions in schooling fish. PNAS (2011).
Read source 10 -
Attanasi, A. et al. Collective Behaviour without Collective Order in Wild Swarms of Midges. PLOS Computational Biology (2014).
Read source 11 -
Zitterbart, D. P., Wienecke, B., Butler, J. P., & Fabry, B. Coordinated Movements Prevent Jamming in an Emperor Penguin Huddle. PLOS ONE 6(6), e20260 (2011).
Read source 12 -
Sumpter, D. J. T. The principles of collective animal behaviour. Philosophical Transactions of the Royal Society B (2006; review material on self-organized ant trails and other systems).
Read source 13 -
U.S. Air Force. AFMAN 11-2T-38A-B, tactical formation guidance, including line abreast and wedge formations.
Read source 14
Research note: This article analyzes publicly released copies of DoD/AARO imagery. The image measurements are two-dimensional and pixel-based. They do not establish physical object count, range, true separation, velocity, propulsion, intent, or origin.
Share this article

yankee0one
Decade of experience watching PBS Space Time on YouTube.
Related Articles

Nuclear Energy and Metric Propulsion: Testing a Speculative Coupling
A conceptual examination of the missing physics behind a hypothetical nuclear-to-field coupling, with explicit assumptions, equations, and test requirements.
Read more
Connections and Emergence: Mathematics Behind Networked Systems
How weighted connections, optimization, and feedback help explain collective behavior in neural networks and inform questions about cyber defense.
Read more
Rules of Life: Simulating Evolution in a Shifting World
An illustrative model of how resource scarcity, mutation, and environmental change affect survival, with limits on what the reported results establish.
Read more