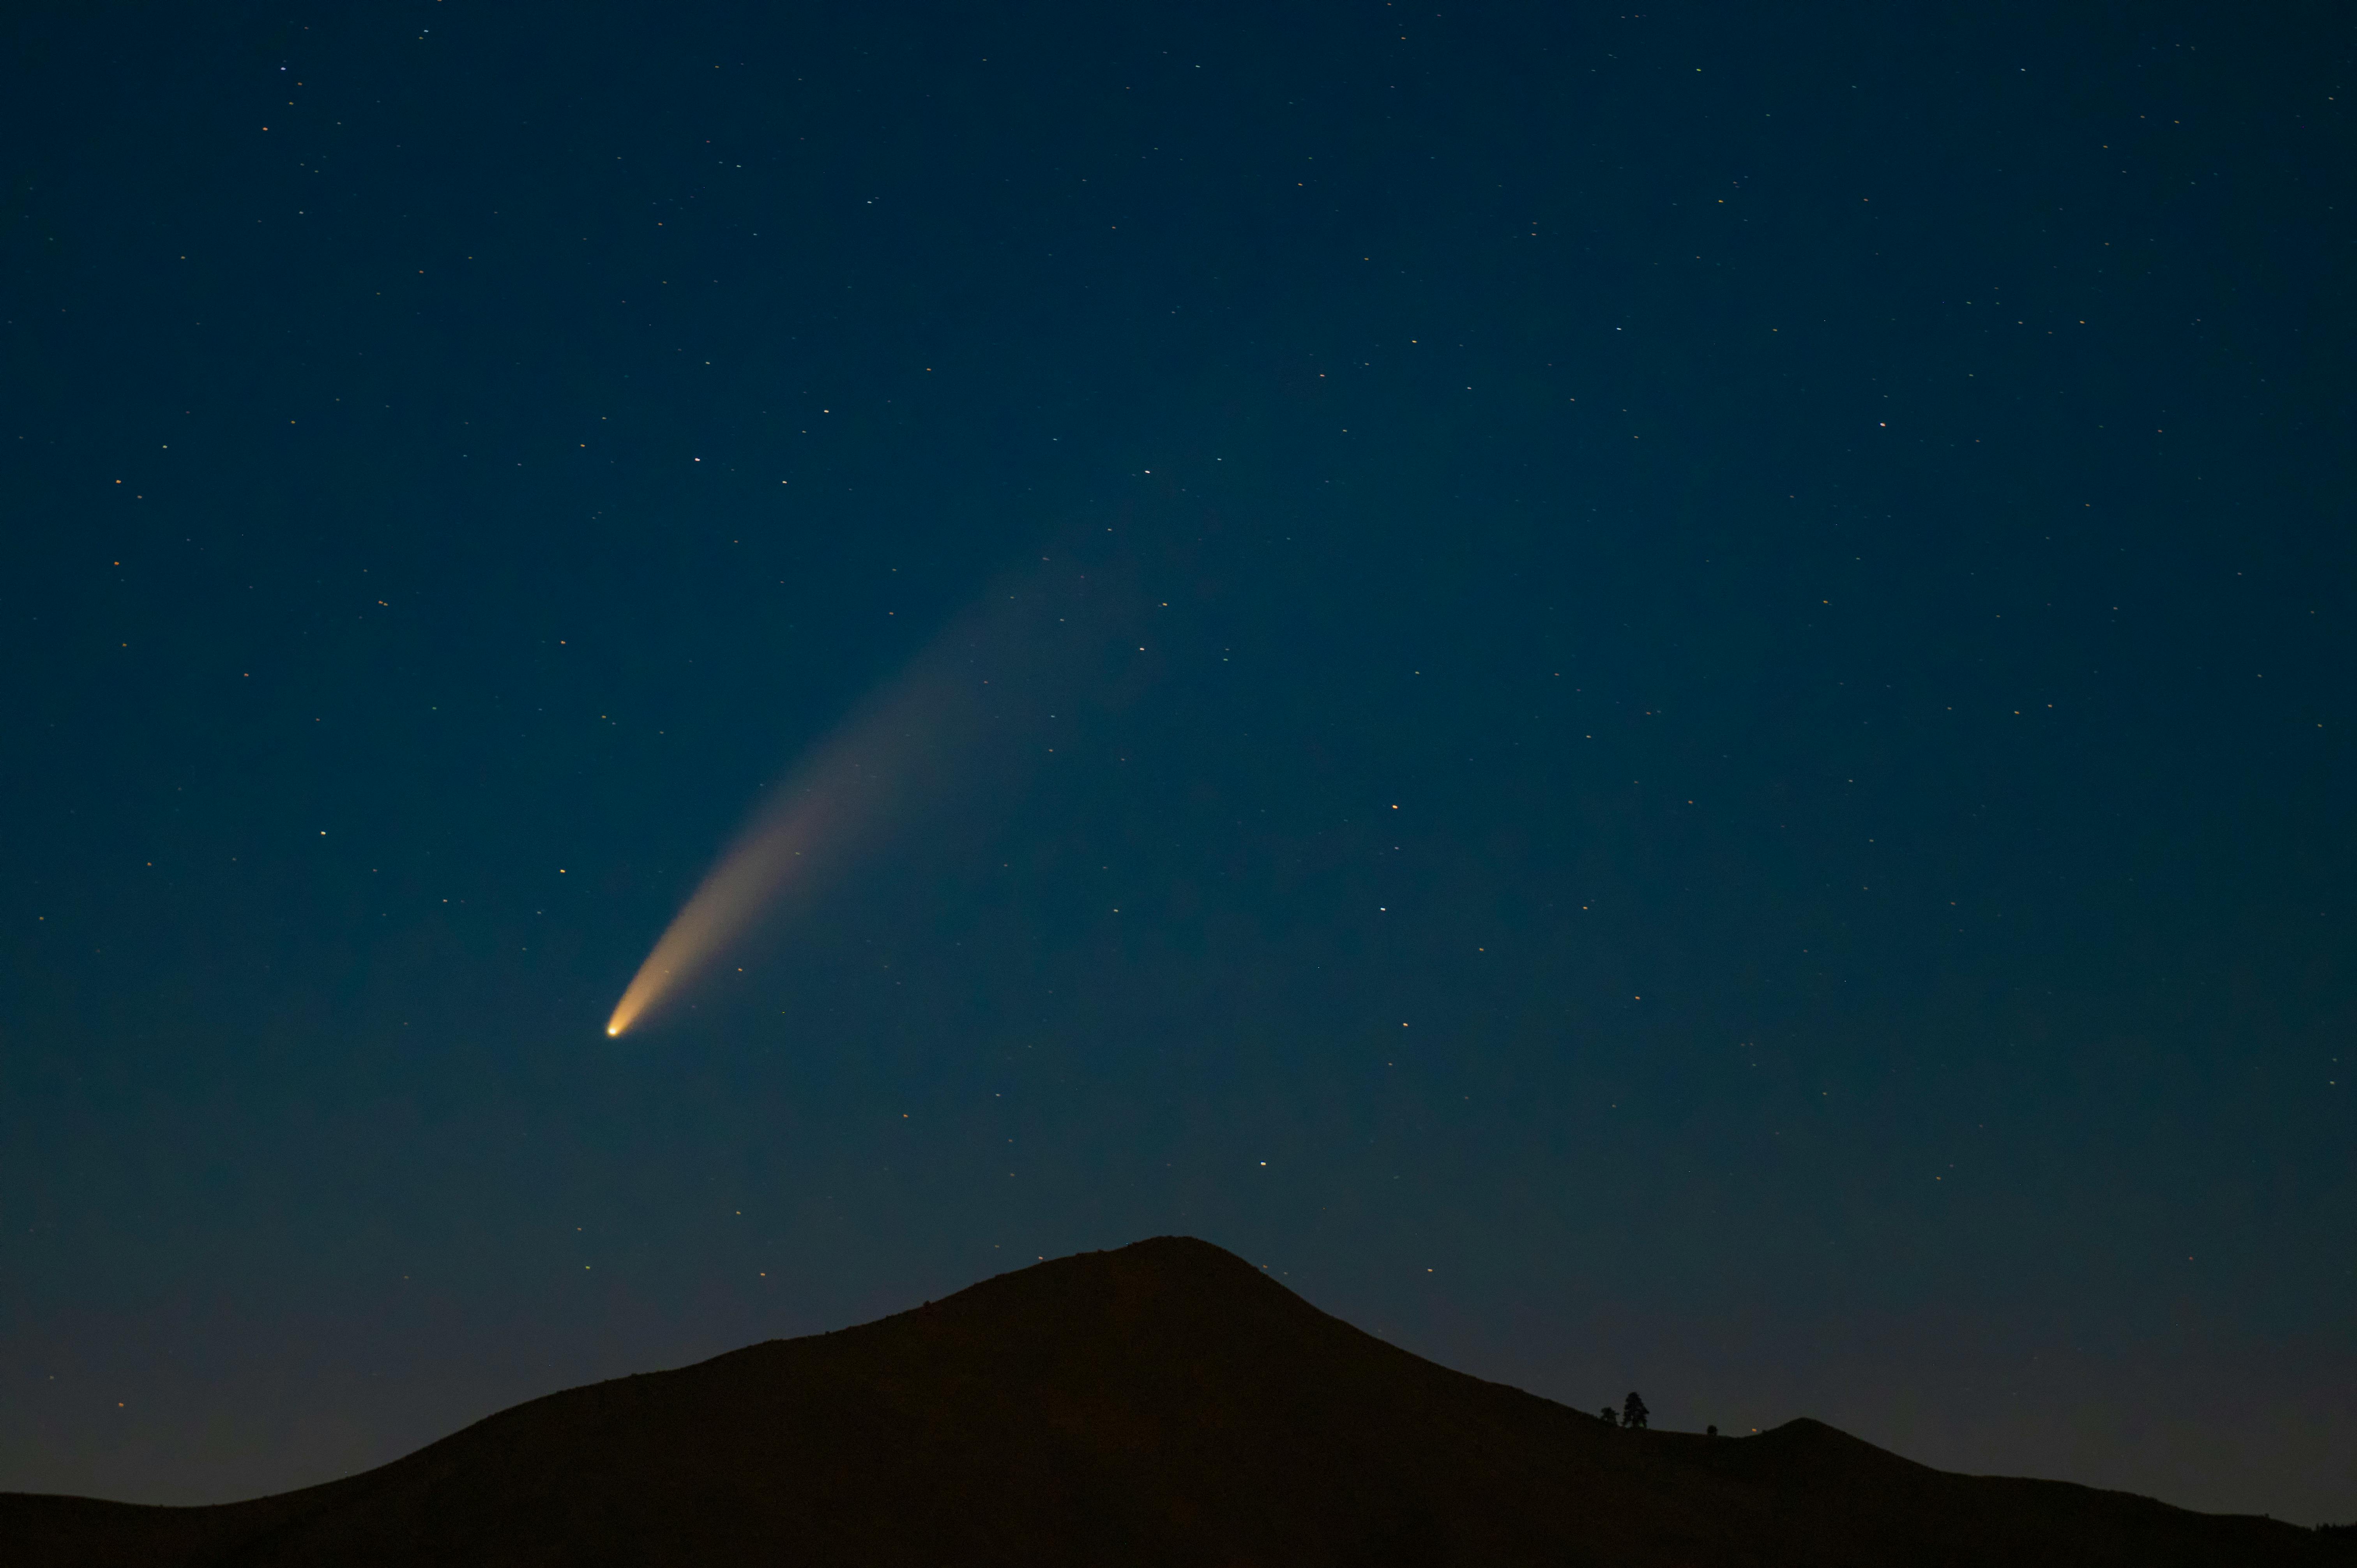
An interstellar comet gives us material from another planetary system to study without leaving our own. The opportunity comes with a constraint: we observe it briefly, through a changing cloud of gas and dust, using instruments that measure different parts of that cloud.
3I/ATLAS, also designated C/2025 N1, was discovered on July 1, 2025. Its orbit and cometary activity make it the third confirmed interstellar object in the discovery record described by NASA.
This log covers the observations discussed in the original October 2025 article and its November 3 update. The September 2026 revision clarifies wording, references, and uncertainty; it does not claim to incorporate the full subsequent observing campaign.
Explain what is being measured
A comet’s coma is the gas and dust surrounding its nucleus. Spectroscopy identifies features associated with particular species, while imaging shows how emission and scattered light vary across the coma.
A production rate, written Q, is an estimate of the amount released per unit time. It depends on a model connecting the measured signal to the emitting material. Aperture size, fluorescence assumptions, dust subtraction, and geometry can affect the estimate.
In the table, distances from the Sun are given in astronomical units (au), and production rates are in molecules per second unless stated otherwise. A nondetection provides an upper limit under the stated conditions. It does not establish that the species is absent.
Observation log
| Observation period | Facility and geometry | Reported result | Qualification | Source |
|---|---|---|---|---|
| July 1, 2025 | ATLAS, Chile | Discovery observations; later designated 3I/ATLAS = C/2025 N1 | Discovery and designation are separate reporting steps | MPC circular |
| July 31 to August 1, 2025 | Swift/UVOT; 3.51 au | OH emission used to infer Q(H₂O) = (1.35 ± 0.27) × 10²⁷ s⁻¹ | Depends on the stated reddening and coma assumptions | Water detection |
| August 6, 2025 | JWST/NIRSpec; about 3.3 au | CO₂-dominated gas coma, with H₂O, CO, water ice, and dust; initial CO₂/H₂O ratio 8.0 ± 1.0 | Ratio is associated with the cited initial analysis, rather than all epochs | JWST analysis, v1 |
| Mid-August 2025 | SPHEREx and IRTF | CO₂ coma of about 3 arcmin radius; Q(CO₂) ≈ 9.4 × 10²⁶ s⁻¹; water-ice absorption | Preliminary 3σ upper limits: Q(H₂O) ≤ 1.5 × 10²⁶ and Q(CO) ≤ 2.8 × 10²⁶ s⁻¹ | SPHEREx analysis, v2 |
| July–August 2025; latest cited X-shooter observation August 21 | VLT/X-shooter and UVES; about 4.4 to 2.85 au | CN and Ni I emission; Fe I undetected; optical continuum slope about 21–22% per 1000 Å | Limits and detections apply to the observations and reduction described in the source | VLT analysis, v1 |
| August 24, 2025 | Keck II/KCWI | Characteristic e-folding radii: Ni 593.7 ± 14.8 km; CN 841.0 ± 15.4 km | Initial analysis indicates more centrally concentrated Ni emission | Spatial profiles, v1 |
| September–October 2025 | STEREO-A, SOHO, and GOES-19 instruments | Brightness scaling approximately r^(-7.5 ± 1.0); color bluer than the Sun; CCOR-1 coma about 4 arcmin in diameter |
Fit describes the measured approach interval; angular diameter is not a nucleus size | Rapid brightening, v1 |
The final row’s brightness relation is written more explicitly as brightness ∝ r^(-7.5 ± 1.0), where r is heliocentric distance. It is an empirical fit over the cited observations, rather than a law to extend indefinitely.
Unresolved entry retained from the November update
The earlier log included reports of ground-based detections on November 1–3, 2025, attributed to the Lowell Discovery Telescope and amateur observers. It did not provide a traceable observing note or source for those claims.
That entry remains unverified in this log. It is excluded from the quantitative synthesis until a source establishes the observing time, instrument, images, and reduction. Retaining its status preserves the editorial record without treating an unattributed report as a measurement.
Interpret the water and carbon dioxide evidence
Swift’s OH measurement provides indirect evidence of water activity. The authors discuss an extended contribution from icy material as a possible explanation for activity at that distance. That interpretation depends on the signal extraction and physical model; it is not a direct measurement of every source of water in the coma.
The JWST and SPHEREx results establish prominent CO₂-related emission in their observations. They also show why one instrument’s measurement should not simply be substituted for another’s. Different dates, wavelengths, apertures, and sensitivity limits can produce different constraints.
A water upper limit from one observation does not necessarily contradict water-related emission measured elsewhere. Compare the geometry and modeling assumptions before combining rates or interpreting a ratio as the composition of the whole nucleus.
Interpret the nickel evidence
Ni I denotes neutral atomic nickel. Its detection, alongside a nondetection of Fe I under particular observing conditions, raises a question about how material is released into the coma.
The VLT authors discuss low-energy release mechanisms involving dust and possible nickel-bearing parent species. The Keck spatial profiles provide a related constraint: in the cited initial analysis, nickel emission is concentrated closer to the nucleus than CN emission.
These observations can help test parent lifetimes and release pathways. They do not establish a unique chemical carrier, and they provide no requirement for an artificial origin. A nondetection of iron in one dataset should remain an observational limit rather than a claim about the object’s complete composition.
Use perihelion as an observing boundary
NASA places perihelion in late October 2025 at roughly 1.4 au and reports that the comet did not pose a threat to Earth. Observations near conjunction required instruments with suitable viewing geometry; the solar-monitoring measurements supplied part of that record.
The scientific questions identified around that interval remain useful for comparing the campaign’s stages. Did gas ratios change as heating increased? Did iron become detectable? Did the spatial profiles of nickel and CN change? Were brightness changes caused by dust, gas, geometry, or a combination?
Those questions specify what to compare. This historical log does not imply that every planned observation occurred or that subsequent work has left the questions unanswered.
Keep the evidence reproducible
The linked papers provide the methods and reported values used here. This article does not include an independent reduction, downloadable analysis dataset, or accompanying notebooks. The original promises of future files should not be treated as available resources.
A reproducible extension would preserve the paper version, observing interval, extraction aperture, assumptions, and uncertainties for each value. Corrections should identify which earlier entry they affect.
Revision record
- October 18, 2025: Original compilation of Swift, JWST, SPHEREx, VLT, and Keck observations.
- November 3, 2025: Earlier update added near-perihelion observations and unattributed ground-detection reports.
- September 8, 2026: Revised the prose, added traceable paper links, clarified measurement definitions, and separated the unresolved ground-report entry.
What makes 3I/ATLAS worth studying is the opportunity to connect chemistry, activity, and the history of material from another system. The useful next step for a reader extending this log is a comparison across observing epochs that keeps the instrument and model assumptions visible.
Share this article

yankee0one
Decade of experience watching PBS Space Time
Related Articles
Working with Vera C. Rubin Observatory Data
How Rubin observations become images, catalogs, and alerts, and how to choose an access route and investigate a candidate variable source.
Read more
Illustrating UFO Witness Reports with Generative AI
A method for turning reported observations into labeled illustrations while preserving the distinction between testimony, interpretation, and evidence.
Read more
Mars in 2025: What Has to Work Before a Human Landing
A 2025 perspective on the demonstrations, infrastructure, and mission decisions needed to support people on Mars.
Read more