A star that changes brightness can be difficult to understand from one image. Repeated observations reveal its behavior over time and let researchers compare the change with instrumental effects or activity in nearby sources.
That is what makes the Vera C. Rubin Observatory’s Legacy Survey of Space and Time (LSST) interesting. It is designed to connect repeated measurements across a large area of sky, supporting work on changing sources, moving objects, and the structure of the universe.
Understand the path from an image to a finding
Rubin’s wide-field telescope and camera collect images through several filters. Before those observations become scientific measurements, processing must account for instrumental effects and calibrate positions and brightness.
Image differencing compares an observation with a reference image to identify change. A residual may be an astrophysical event, a moving object, or an artifact that needs further examination. An alert is therefore a starting point for analysis.
Rubin’s data-product overview distinguishes science-ready images, catalogs, and alerts. Choose the product that answers the question rather than treating all survey data as interchangeable.
Check the access route
Access depends on the product and the service. Rubin’s data policy defines data rights and account eligibility. A public project description does not imply that every dataset is immediately available to every user.
Rubin describes its alert stream as world-public, with access through community brokers. A broker receives and organizes alerts so users can filter them and find candidates relevant to their interests.
The Rubin Science Platform has separate access requirements. Check eligibility and the documentation for the available release before planning an analysis. This access guidance was checked for the September 2026 revision; the article’s original publication date is retained.
Choose a platform interface
Rubin’s access and analysis guide describes three interfaces:
| Interface | Use |
|---|---|
| Portal | Discover and visualize data through a browser |
| Notebook | Work interactively with data and code |
| API | Access services programmatically using supported standards |
The appropriate interface depends on the task. A visual inspection may begin in the Portal, while repeated calculations may suit a notebook or an API workflow.
Use tutorials for the dataset and service you can access. Schema names, product availability, and examples can differ among releases. Save the release identifier and query with the analysis.
Understand the software’s role
The LSST Science Pipelines provide processing tools, while data access and organization involve components such as the Butler. Installing software is a separate step from obtaining data rights or reproducing the observatory’s full processing environment.
Start with a supported tutorial and a small query. Confirm units, flags, and calibration assumptions before scaling up. Record software versions when they can affect the result.
The Rubin community forum and LSST software repositories provide places to examine workflows and documentation. A community example should still be checked against the release being used.
Investigate a candidate variable source
Suppose a broker identifies an object with changing brightness. First inspect the individual detections and quality flags. Look for image artifacts, blending with nearby objects, and measurements close to the detection limit.
Retrieve the available history and compare observations in compatible filters. Cross-match with other catalogs to determine whether the object is already known and whether another survey records similar behavior.
A period-search method such as Lomb–Scargle can help examine repeated variation. Its result needs checks for sampling aliases and instrumental patterns. An apparent period is a hypothesis to test.
Keep the images, query, selection criteria, and rejected measurements in the record. If the candidate remains interesting, follow the relevant collaboration or community reporting process with enough information for another person to assess it.
Make the first analysis reproducible
Choose one bounded question: whether a particular source varies, whether a detection is an artifact, or whether an object matches an existing catalog entry. Use a small dataset and document each step.
The scale of Rubin’s survey creates opportunities, but a discovery still depends on an inspectable chain from observation to conclusion. That is a useful place for a curious researcher to begin.
Share this article

yankee0one
Decade of experience watching PBS Space Time on youtube.
Related Articles
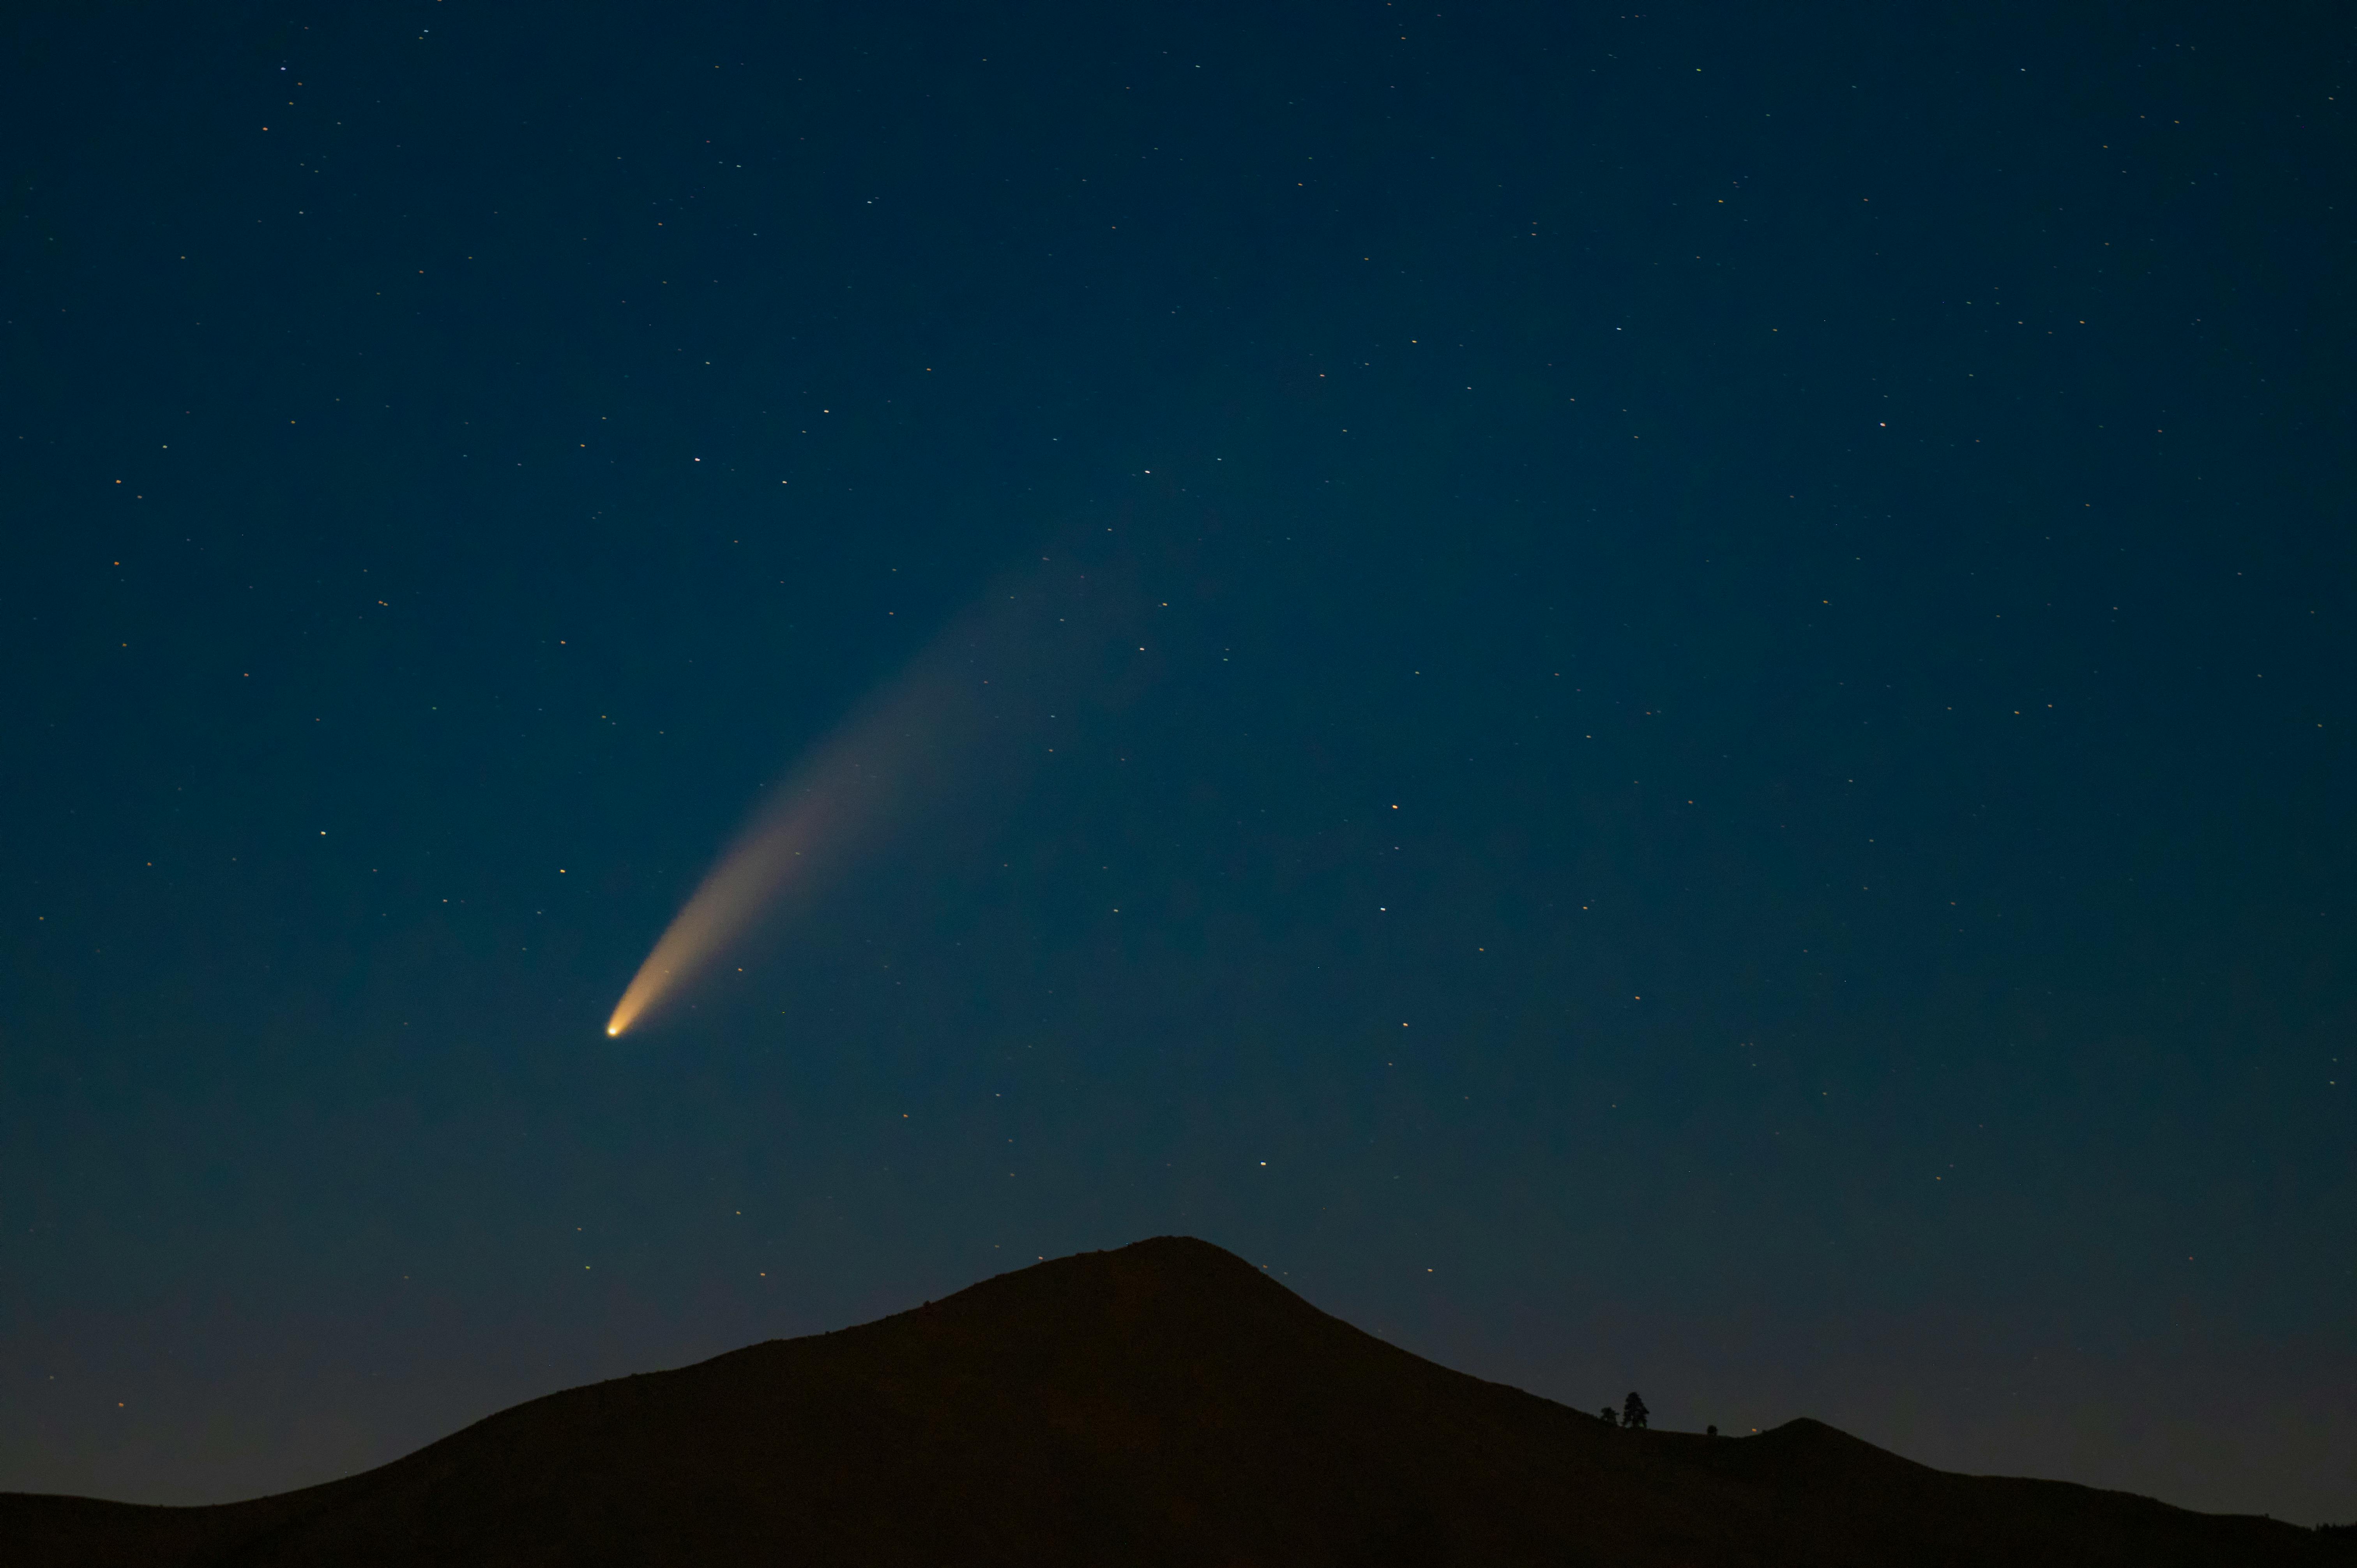
3I/ATLAS: An Evidence Log of the 2025 Observations
A historical log of Swift, JWST, SPHEREx, VLT, Keck, and solar-monitoring observations, separating measurements, model-dependent estimates, and unresolved reports.
Read more
Illustrating UFO Witness Reports with Generative AI
A method for turning reported observations into labeled illustrations while preserving the distinction between testimony, interpretation, and evidence.
Read more
Mars in 2025: What Has to Work Before a Human Landing
A 2025 perspective on the demonstrations, infrastructure, and mission decisions needed to support people on Mars.
Read more